
Track & Graph: Habit Tracker
Personalized Dashboards for Life Tracking
• Track & Graph is a flexible tool designed to help you log, monitor, and analyze habits, behaviors, and daily metrics through custom visual dashboards.
Comprehensive Tracking and Organization
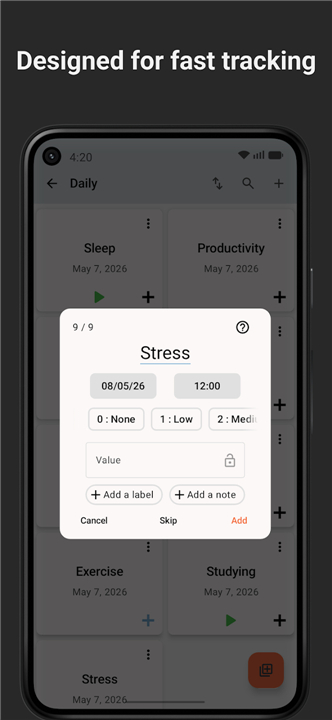
• Record discrete event occurrences or continuous numerical data such as mood, exercise, or spending.
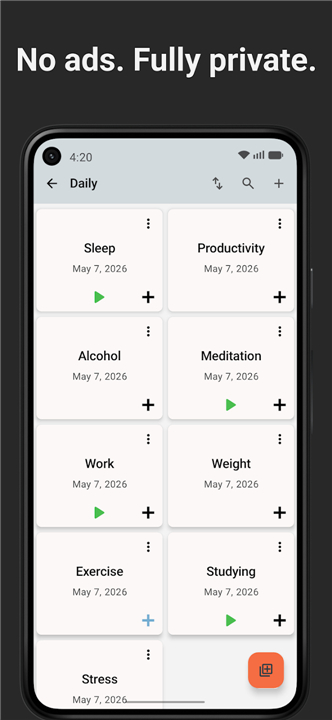
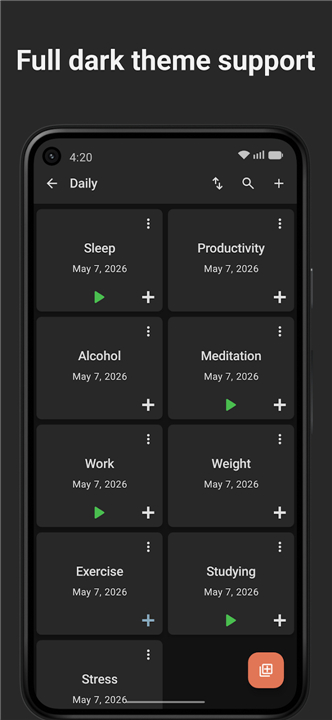
• Build customizable dashboards to display your most important habit trackers in one centralized location.
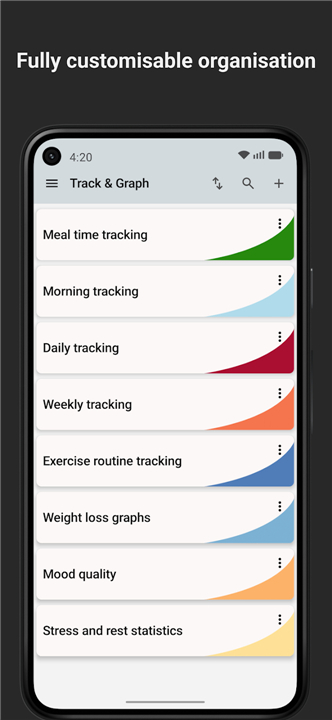
• Organize tracking items into personalized groups and categories tailored to your unique daily routine.
Data Visualization and Analytics
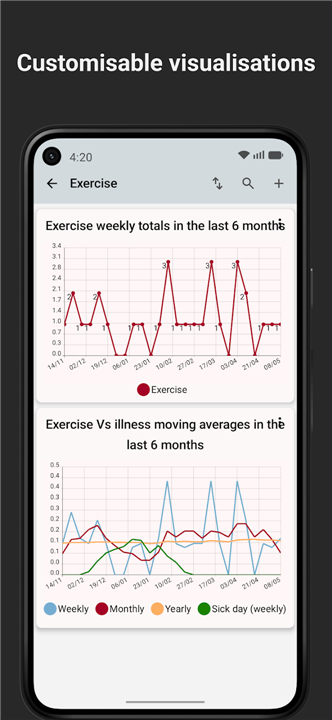
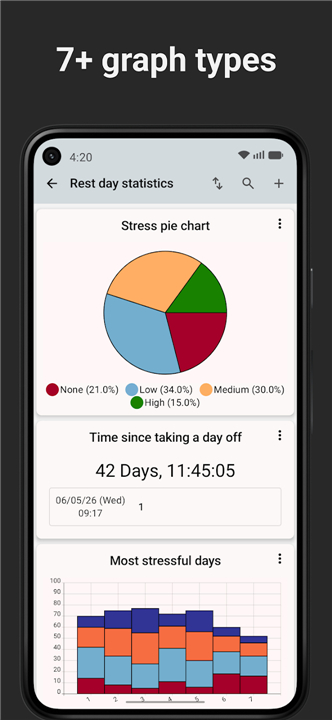
• Generate line graphs and pie charts to visually uncover behavioral trends and progress over time.
• Review detailed statistical reports displaying moving averages, totals, and exact time intervals between logged events.
• Identify long-term patterns to gain actionable insights into your lifestyle habits and routines.
Custom Scripting and Advanced Metrics
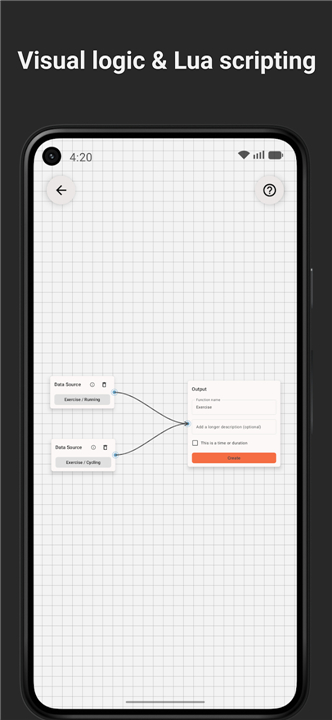
• Leverage an embedded Lua scripting API to create tailored mathematical calculations.
• Compute complex metrics, including cumulative sums, rate-of-change differentials, or financial tracking formulas.
• Customize how raw tracking data is processed and presented to fit unique personal projects.
Privacy and Open-Source Freedom
• Enjoy a completely free, open-source application with no advertisements, required user accounts, or hidden in-app purchases.
• Protect personal information with offline, local storage that keeps all data exclusively on your device.
• Export and create full backups of your tracking data whenever necessary.
FAQ
Q: How do I start a new habit tracker within the app?
A: When you first open Track & Graph, click the “+ New Tracker” button on the home screen. You’ll be prompted to give the tracker a name, choose a data type (discrete event or continuous numeric), and set any default units or ranges. After you confirm, the tracker appears in your list ready for you to begin logging entries.
Q: Can I group related trackers together?
A: Absolutely. After creating a tracker, select the “Edit” option and assign it to a custom group or category—like “Health,” “Finances,” or “Creative Projects.” You can create as many groups as you like, and each group can be displayed on its own tab within a dashboard, keeping everything tidy and context‑specific.
Q: What kinds of visualizations are available?
A: Track & Graph supports line graphs, bar charts, and pie charts. Line graphs are ideal for spotting trends over time, bar charts help you compare discrete events, and pie charts give a quick snapshot of proportional data such as time spent on different activities. All visualizations are fully customizable—colors, axes, and time windows can be adjusted with a few clicks.
Version History
v10.2.2——20 Aug 2026
Dashboards for life! Download the latest version of Track & Graph: Habit Tracker to enjoy new features and updates immediately!
*10.2.2
- Fix history screen crash on data points with exact matching timestamps
- Fix bar chart value formatting crash
- Remove buy me a coffee link from playstore builds
*10.2.1
Patch release fixing the release resource build failure reported for F-Droid/IzzyOnDroid builds.
*10.2.0
Adds App Lock, so you can protect Track & Graph with a lock screen when someone else has access to your device.
Also new:
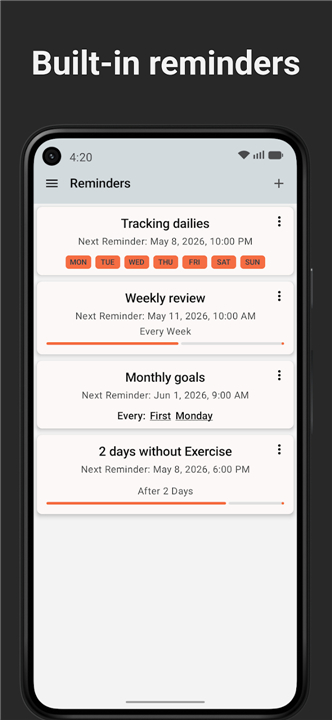
- Enable or disable reminders without deleting them
- Better bar chart zooming and highlighting
- Smoother note and data point row animations
- Haptic feedback when adding data points
- Search now matches dates and times
- Fixed a Unicode fuzzy-search crash
- AppSize7.04M
- System Requirements5.0 and up
- Is there a feeFree(In game purchase items)
- AppLanguage English
- Package Namecom.samco.trackandgraph
- MD5
- PublisherSamAmco
- Content RatingTeenDiverse Content Discretion Advised
- Privilege19
-
Track & Graph: Habit Tracker 10.2.2Install
7.04M2026-08-22Updated








7.0
1309 Human Evaluation
- 5 Star
- 4 Star
- 3 Star
- 2 Star
- 1 Star